
You are 32, you train five days a week, and you search for cardiovascular risk. What comes back is the Dutch CVRM guideline, a guideline database and a risk table that starts at age 40. None of those pages was written for you.
I think that is the biggest gap in Dutch heart content.
The models behind those tables are sound. They were simply built for a different reader, using different inputs than the numbers you actually track.
What is cardiovascular risk anyway?
It is a probability estimate, not a diagnosis. A model takes a handful of your characteristics and works out what percentage chance a group of people like you runs over ten years. That number says something about the group, and remarkably little about your own arteries.
That distinction carries this whole piece.
In the Netherlands the estimate runs through CVRM, the guideline for cardiovascular risk management. Your GP uses it to decide who might benefit from treatment. The Hartstichting explains the same risk factors in plain language, and the RIVM tracks how much cardiovascular disease the country actually sees.
That is useful work. It was just never built to judge your training year, and nobody says that out loud.
Why can SCORE2 not score you under 40?
Because the model was never made for that. SCORE2 was derived and validated in European cohorts of people without known cardiovascular disease, aged roughly 40 to 70 years (PMID 34120177). A separate version exists for people over 70. Below 40 there is nothing at all.
So you can fill the table in. It will simply be calculating outside the range where it was tested.
That is not a footnote. It means the best-known risk tool in the country has no answer for exactly the group that searches for it most.
There is a second wrinkle. SCORE2 is also calibrated per region, and the Netherlands sits in the low-risk group. The same inputs produce a different percentage in another European country.
An answer that depends on your postcode is not a property of your artery wall.
Why is a low ten-year risk less reassuring than it looks?
Because age is the heaviest term in the sum. For someone aged 32 the output is almost always a low percentage, whatever the rest of the profile does. So you get a comforting number back from a model that mostly noticed you are young.
Ten years is a short window for a slow process.
Atherosclerosis builds over decades. A risk estimate that looks exactly ten years ahead knows nothing about the twenty-five years after that, and that is the part that matters to you.
Researchers call that split ten-year risk versus lifetime risk. For a young reader those are two very different questions, and the table only answers the first.
What does SCORE2 actually use, and what does it miss?
The model runs on six fields: age, sex, smoking, systolic blood pressure, total cholesterol and HDL cholesterol. That is the complete input. Everything else you track, on your watch, in the gym or on your last blood result, falls outside those six fields (PMID 34120177).
Smoking is also just a yes or no. How much you smoked and how long ago you quit do not fit in that box.
Family history is not in there. Neither is diabetes, which has its own separate variant. Here is what the gap looks like next to your own result.
| What SCORE2 uses | What it does not see | Which value covers that gap |
|---|---|---|
| Total cholesterol and HDL | How many atherogenic particles you really carry | ApoB |
| Age and sex | Inherited load you have carried since birth | Lp(a) |
| One systolic blood pressure | Your pressure across the day and under the bar | Repeated resting readings, plus potassium and sodium |
| Smoking as a yes or no | Your fitness, the thing you work on five days a week | VO2max from an exercise test |
| Nothing about inflammation | Low-grade inflammation in the artery wall | hs-CRP |
| Nothing about methylation | An abnormal homocysteine value | Homocysteine |
| Ages 40 to 70 | Anyone younger than that | An early baseline of your lipids |
The third column is what this piece is about. Every gap in column two has a blood value that says something about it. None of those values appears in the table your GP fills in.
Why does ApoB count for more than your cholesterol number?
Because ApoB counts particles and cholesterol weighs cargo. Every LDL, IDL and VLDL particle carries exactly one apoB molecule, so your apoB value is a direct headcount. Two people with the same LDL can carry different particle numbers, and research suggests that count adds information.
SCORE2 does not ask for apoB.
That is understandable. The model was built on cohorts where total cholesterol and HDL were available everywhere, and apoB often was not.
The European Atherosclerosis Society is clear about LDL itself. The panel concluded that the evidence supports a causal role for LDL in atherosclerosis. The level is not the only thing that counts, so does the duration of exposure (PMID 28444290).
Duration is exactly what a ten-year table cannot capture. A mildly raised particle count that runs from your thirties onward sits differently from the same number appearing at sixty.
The full explanation sits in ApoB, the heart risk marker your GP usually skips.
What does Lp(a) do in this picture?
Lp(a) is the slice of risk you get from your parents. The value is largely genetically set and shifts little with your diet or your training. Some people carry a high value with nothing else standing out in their profile, and no risk table asks about it.
That makes it the quieter of the two gaps.
A high apoB you can see coming from your lipid panel. A high Lp(a) can sit next to a perfectly tidy cholesterol number without leaving a trace anywhere.
Some people choose to have that value measured once, precisely because so little else hints at it. What the number does and does not mean sits in Lp(a), the inherited heart risk marker your doctor rarely measures.
Does your fitness count toward your cardiovascular risk?
Not in the model, but very much in the literature. SCORE2 has no field for fitness, VO2max or training hours. Yet fitness sits among the factors most strongly associated with long-term mortality, and you work on it five days a week. Of all the gaps, that one feels the most lopsided.
The largest study on this followed 122,007 people who did a treadmill test. Higher fitness was associated with lower mortality, and the researchers found no upper limit to that relationship (PMID 30646252). The strongest group did better than the group below it, and that group better than the one below again.
An association like that is not proof of cause. It stays observational, and fit people differ on more than their VO2max alone.
It still sits in sharp contrast with a model that has zero fields for it.
Practically, that means this: your hardest effort of the week appears nowhere in any Dutch risk estimate. Your smoking status does.
What does your blood pressure do under the bar?
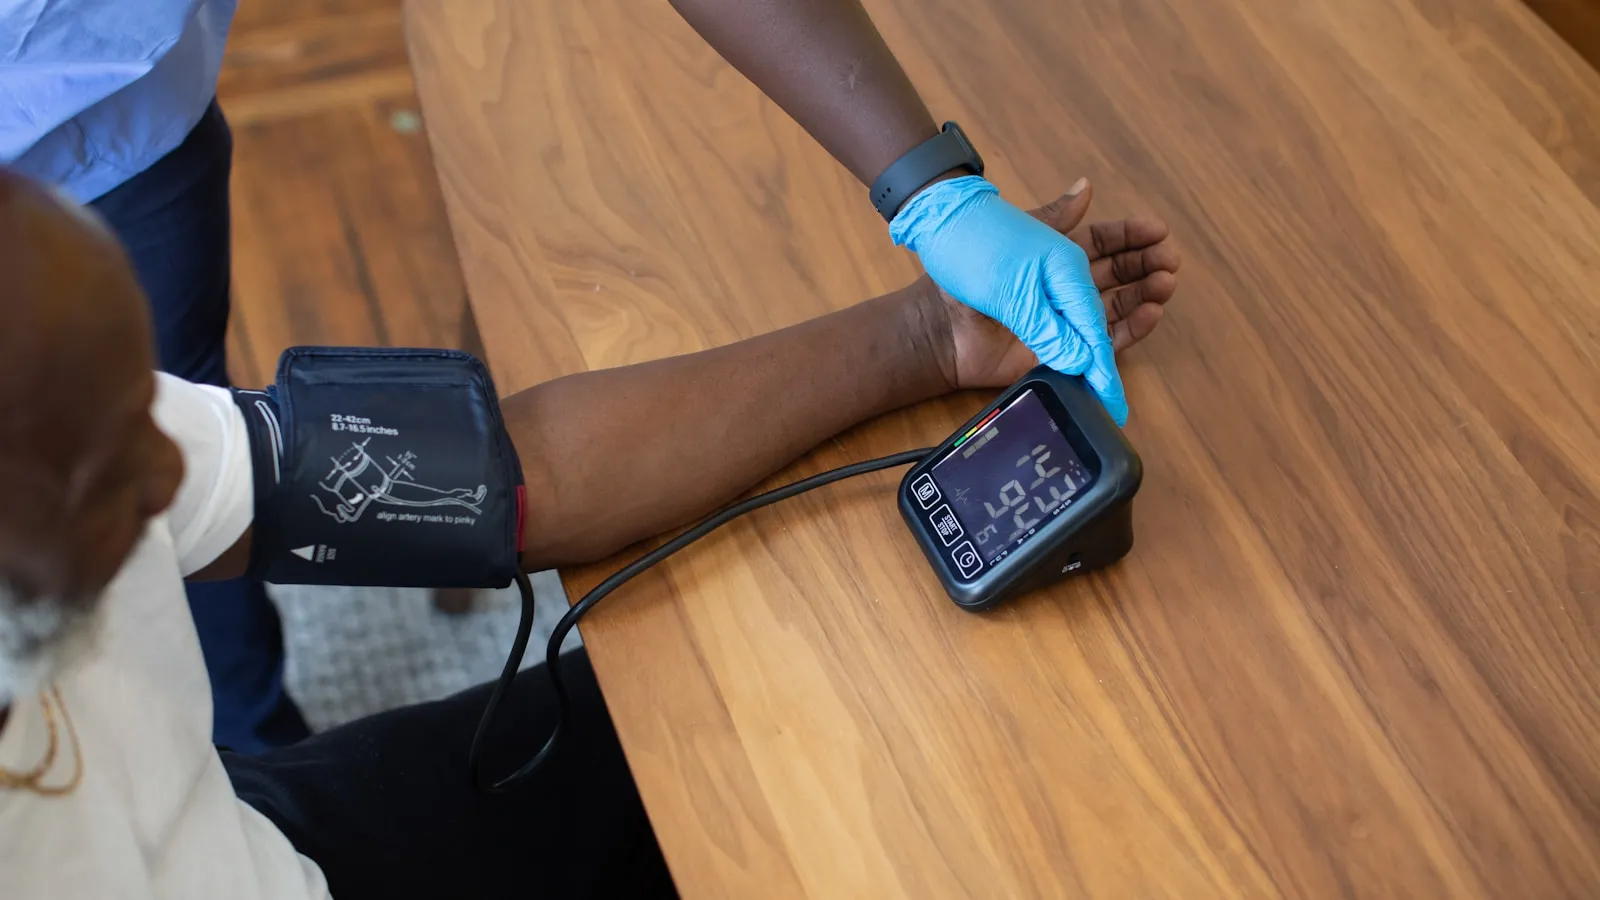
It spikes, and that belongs to the lift. During a heavy set your blood pressure rises steeply for a short time, especially if you hold your breath. That is a different thing from a raised resting pressure, and resting pressure is the only one a risk model asks for.
This is where athletes often get misread. You measure once, in a consulting room, shortly after a heavy training block, and that single number goes into the table.
Systolic pressure is one of the six fields, so an unlucky reading really does move your output.
The Hartstichting therefore points people toward a series of readings rather than one moment. That advice matters even more for athletes, because your pressure tracks your training load.
What strength training really does to your pressure sits in training with high blood pressure.
What does your heart rate say about this?
Less than you hope about risk, and more than you think about training. Heart rate is not in SCORE2 at all. Yet it is the number you look at most often, and most athletes have their zones set from a formula that does not fit them.
A wrong zone does not raise your risk.
It only makes your training less targeted, and training is the one factor you can actually turn. Setting your zones properly costs an afternoon and changes your whole year.
How to do that properly sits in heart rate during training.
When is a bigger heart simply an athlete's heart?
Usually, if you have trained hard for years. Endurance work and heavy lifting can make the heart muscle grow with you, and that is an adaptation rather than a disease. There is a limit above which a cardiologist prefers to look further, and that limit has been measured in large athlete groups.
This belongs here because it can muddy your risk picture. An echo showing a thicker wall reads differently if nobody knows you have rowed for six years.
In athletes, context is often the difference between a normal result and a referral.
Roughly where that limit sits is covered in athlete's heart, when a bigger heart is normal and when it is not.
What does an exercise test see and miss?
It sees narrowings that limit flow, and it misses much of what does not narrow yet. A bike test looks at your ECG and your performance under rising load. Plaque that does not yet restrict flow often gives off no signal there at all.
That does not make the test useless. It just makes it something other than the reassurance people often book it for.
It also produces one thing you get nowhere else. Your fitness comes out as a number, and that is exactly the factor no risk table includes (PMID 30646252).
What the test does and does not show sits in the exercise stress test explained.
Where does homocysteine fit in?
As a risk marker, and not as a dial to turn casually. A raised homocysteine is associated in population research with more cardiovascular disease. The large studies that lowered the value with vitamins showed no clear drop in the number of heart attacks.
Homocysteine is not in SCORE2 either.
It is one of those values you meet on an extended result without anyone explaining what to do with it. The difference between a marker and a treatment target is the entire story there.
That trade-off sits in homocysteine, risk marker or something to lower.
How should you read your own cardiovascular risk then?
By asking a different question. Not what percentage chance do I run over ten years, because for you that number lands low almost every time. Instead: which of my values has been drifting the wrong way for years, and how long have I carried it?
I think that is the fairer question at your age. Duration of exposure is exactly what the EAS consensus points to, and exactly what a ten-year window erases (PMID 28444290).
Imagine two men aged 34 with identical LDL of 3.4 mmol/l. One has a low particle count and an Lp(a) of almost nothing. The other carries more particles and a high Lp(a) inherited from his father.
SCORE2 gives them the same answer: no answer, because they are too young.
You only see that difference if you measure the two values that fall outside the table. After that you stop reading single results and start reading the direction your values move over the years.
What do you do next?
Some people choose to start with the two values no risk table includes. A lipid panel with apoB shows how many particles you carry, and Lp(a) shows what you inherited. After that you have something concrete to set your blood pressure and your fitness against.
My own preference: write down what you did that week next to every result. A blood pressure after a quiet week reads differently from the same reading after three heavy weeks, and in five years that note is worth more than the number itself.
That series is the thing no table can match.
You draw apoB and your lipid panel with the lipid panel, or more broadly alongside your kidney, liver and inflammation values in 360 Health.
Every blood test result includes a professional assessment from a BIG-registered doctor. For treatment decisions, discuss your results with your GP.
References
- SCORE2 working group and ESC Cardiovascular risk collaboration. SCORE2 risk prediction algorithms: new models to estimate 10-year cardiovascular risk in Europe. European Heart Journal, 2021;42(25):2439-2454. PMID 34120177.
- Mandsager K, Harb S, Cremer P, Phelan D, Nissen SE, Jaber W. Association of cardiorespiratory fitness with long-term mortality among adults undergoing exercise treadmill testing. JAMA Network Open, 2018;1(6):e183605. PMID 30646252.
- Ference BA, Ginsberg HN, Graham I, Ray KK, Packard CJ, Bruckert E, et al. Low-density lipoproteins cause atherosclerotic cardiovascular disease. Evidence from genetic, epidemiologic, and clinical studies. A consensus statement from the European Atherosclerosis Society Consensus Panel. European Heart Journal, 2017;38(32):2459-2472. PMID 28444290.
- Hartstichting. Risk factors for cardiovascular disease.
- NHG. Guideline on cardiovascular risk management.
- RIVM. Figures on cardiovascular disease in the Netherlands.
To see your risk expressed as an age rather than a percentage, use the heart age calculator.
Author
Enhanced Health
Dr. Naimi, BIG-registered physician, oversees the medical standards behind our content and assessments. Read our medical policy
Related Tests
Related Posts

Palpitations and your thyroid: when to have your TSH tested
Heart rate and blood pressure: why the two numbers say different things