A healthy body fat percentage sits roughly between 8 and 20 percent for men aged 20 to 39, and between 21 and 33 percent for women in that age group. The range shifts up a few points every decade. That is the short answer, and it appears on every page you open.
The long answer is more useful. Because almost nobody tells you how imprecise the measurement itself is.
A scale reading 18 percent can be four to eight percent off. Measure your whole cut that way and you are working inside your device's noise.
I read that number for years as though it were an exam grade. Looking back, that was the wrong question.
What is a healthy body fat percentage?
A healthy body fat percentage depends on your age and your sex. For men aged 20 to 39 the range runs roughly from 8 to 20 percent; for women of that age, from 21 to 33 percent. Past 40 the range moves up. Athletes sit below it as a group, and that is normal.
The table below comes from work by Gallagher and colleagues, who derived body fat ranges from BMI boundaries in more than 1,600 adults (PMID 10966886). It is the most cited source behind the tables you see everywhere, even where the source is left out.
| Age | Women: healthy range | Men: healthy range |
|---|---|---|
| 20 to 39 | 21 to 33 percent | 8 to 20 percent |
| 40 to 59 | 23 to 34 percent | 11 to 22 percent |
| 60 to 79 | 24 to 36 percent | 13 to 25 percent |
| Trained athletes | 14 to 22 percent | 6 to 15 percent |
Read those figures as a band, not a target. Women carry more essential fat by nature, including around the organs and in breast tissue.
The athlete row is not a health standard. It describes what competitive athletes reach within a season, not something to hold year round.
How do you measure body fat percentage?
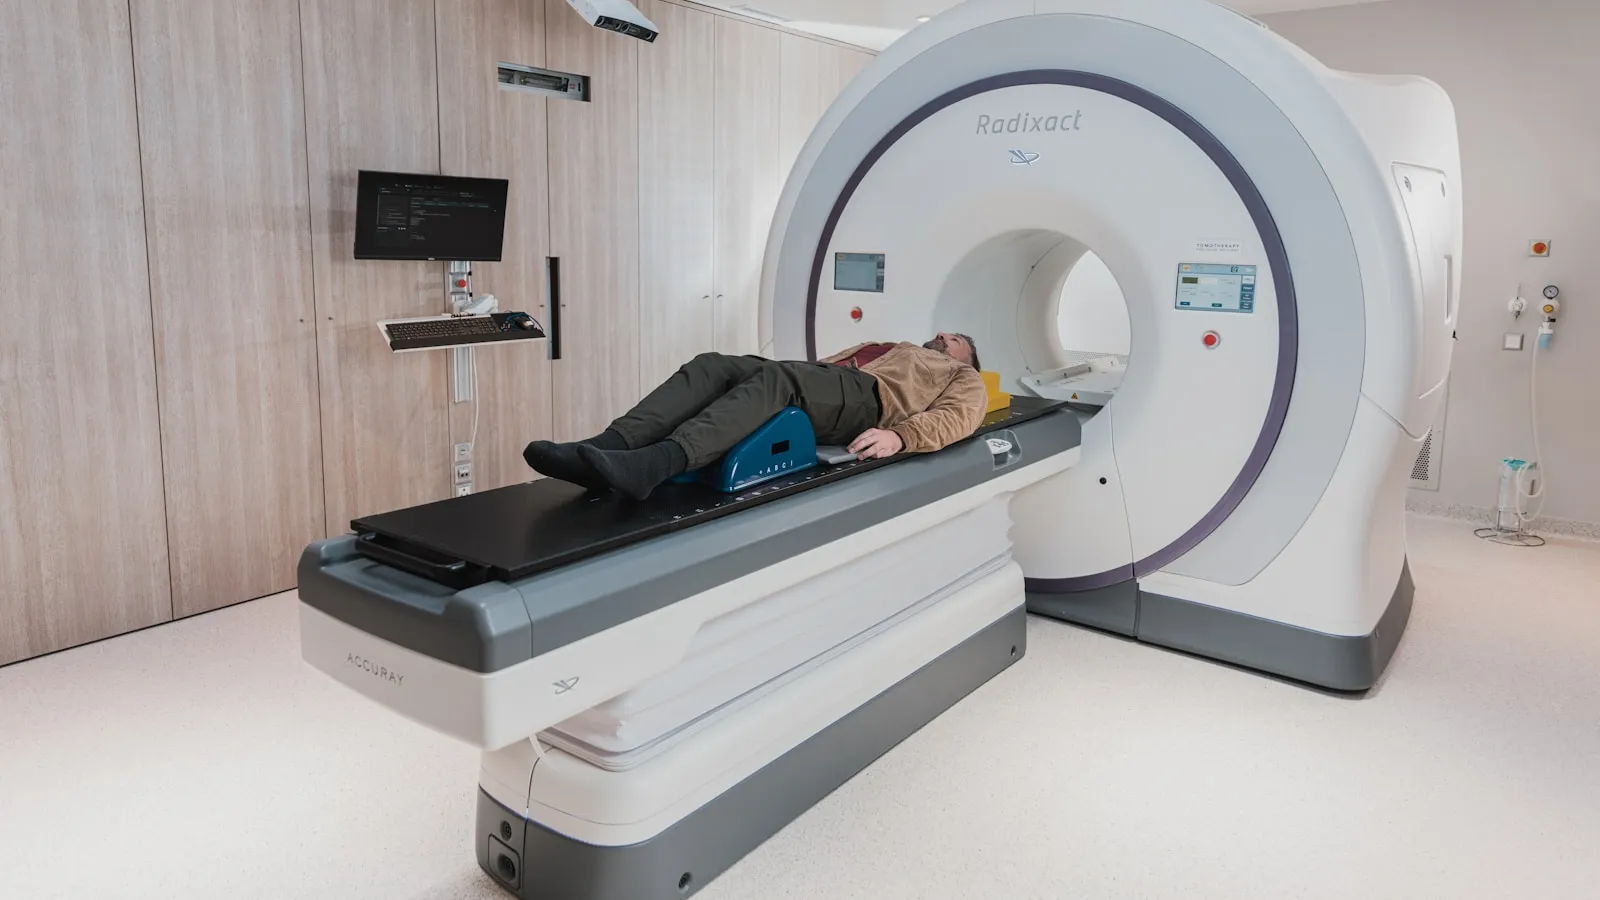
Five methods are realistically available: a DEXA scan, a BodPod, a skinfold measurement with calipers, a professional bioimpedance measurement such as InBody, and a body fat scale at home. They differ less in what they measure than in how directly they measure it.
None of the five weighs your fat. They all measure something else and convert.
A DEXA scan measures how X-rays at two energy levels attenuate through your tissue, then derives fat, muscle and bone from that. Bioimpedance sends a weak current through your body and estimates fat from the resistance, because fat conducts worse than muscle. A skinfold measurement takes the thickness of your subcutaneous fat at set points and converts it through an equation.
Every conversion step adds uncertainty. That is exactly why the accuracy varies so widely.
Each method is worked through separately: the DEXA scan, the skinfold measurement, the InBody measurement and the scale at home.
How accurate is each method really?
The gaps are wider than most pages admit. A DEXA scan reaches precision near one percent on the same day. A good skinfold measurement lands at three to five percent. A home scale sits well below that. That spread decides what your number is good for.
| Method | Typical error | What you can use it for |
|---|---|---|
| DEXA scan | around 1 percent same-day | trend over months, dependable absolute figure |
| BodPod (air displacement) | 2 to 3 percent | trend, on the same unit |
| Skinfolds, practised tester | 3 to 5 percent | trend, same tester and same sites |
| Multifrequency BIA (InBody, pro Tanita) | 3 to 5 percent, limits to 5.6 percent | rough indication, direction over time |
| Body fat scale at home | 4 to 8 percent | direction only, never the absolute figure |
That 5.6 percent is not a guess. Esco and colleagues compared an InBody 720 against DEXA in college athletes. The BIA read 3.3 percent lower on average, and the limits of agreement ran past five percent either way (PMID 25353076).
Translate that to your own cut. Drop from 18 to 15 percent on the scale and that three-point fall is smaller than the device error.
That does not mean you lost nothing. It means your meter cannot demonstrate it.
Those two get confused often, and the difference matters. Your weight on an ordinary scale is accurate. Your waist with a tape measure is too. Only the split between fat and muscle is the estimate that suffers.
The same applies to DEXA, just smaller. Zemski and colleagues scanned resistance-trained athletes twice and arrived at a least significant change near 1.2 percent body fat (PMID 30454952). Below that line you simply cannot tell whether anything moved.
The IOC working group around Ackland reached the same conclusion for sport as a whole in 2012: no practical method measures fat directly, and every field method inherits the assumptions of the reference method it was calibrated against (PMID 22303996).
Why does your body fat percentage jump day to day?
Because most meters measure water, not fat. Bioimpedance estimates fat mass from electrical resistance, and that resistance depends heavily on how much fluid and glycogen you are holding. A salty meal, a hard leg session or a litre of water all move your reading without adding a gram of fat.
That is not a fault. It is how the measurement works.
For athletes it often falls the wrong way. Train down before a competition and you bind less water in your muscles, resistance rises, and the device reads you as fatter than you are. Exactly when you are leanest.
What does work is standardising. Measure fasted, in the morning, after the toilet, before training and before drinking. Same device, same order, every time.
One measurement is noise. Three measurements over six weeks are a line.
The body composition scale suffers most here, because a home scale only measures through your legs and estimates the rest of you.
What does your body fat percentage not tell you?
A surprising amount. Your body fat percentage says how much fat you carry, not how your metabolism handles it. Two people at 18 percent can have opposite fasting insulin, triglycerides and HDL. You will not see that on a scan or in the mirror.
Take two men of 34, both 82 kilos, both at 18 percent body fat. Identical on paper.
The first lifts three times a week and sleeps seven hours. His fasting insulin is low, his triglycerides tidy, his HDL high. The second barely moves, carries his fat mostly around his waist and sleeps five hours. His fasting glucose sits at the top of the range and his triglycerides are nearly twice as high.
Same body fat percentage. Different body.
Romero-Corral and colleagues described this as normal weight obesity: people with a normal BMI but a high body fat percentage more often showed metabolic abnormalities, and in women the pattern tracked with higher cardiovascular mortality over the following years (PMID 19933515). That is an association in a large group, not a prediction for you.
This is what strikes me most about the whole debate.
Everyone chases a number that does not answer the question. Whether your fat tissue is getting in your metabolic way shows up sooner in your fasting insulin, your triglycerides and your HDL than in a percentage on a display. Those values sit together in the 360 health panel.
Where the fat sits also weighs more than how much there is. We work that through in visceral fat, and the cheapest usable proxy remains measuring your waist. The Voedingscentrum uses 94 centimetres for men and 80 for women as a first signal boundary.
According to figures RIVM tracks through the Leefstijlmonitor, about half of Dutch adults carry excess weight. A body fat percentage places you in that distribution. It does not tell you what your body is doing with it.
Which body fat percentage is too low?
Below roughly 5 percent in men and 12 percent in women you approach essential fat, the fat held in your organs, your nervous system and your cell membranes. Going lower tends to cause problems sooner in women than in men, and the risk sits less in the number than in the energy deficit needed to reach it.
That distinction matters. The body fat percentage is not what makes you unwell; the road there is.
The IOC gathered this in 2023 under REDs, relative energy deficiency in sport. Sustained low energy availability is associated with disturbances in bone formation, hormones, immune function and performance, in men as well as women (PMID 37752011). In women, losing the menstrual cycle is the clearest early signal.
If you stay below your range while training continues, that is a reason to revisit your energy intake. Discuss persistent symptoms with your GP.
What do you do with your own number?
Compare it against yourself three months ago, not against the table. Pick one method, measure it under the same conditions, and read the direction over at least six weeks. A difference smaller than your device error is not a change.
My other advice: put a second number beside it that does not come from the same device. Your waist in centimetres, or whether a fixed pair of trousers closes.
Two independent measurements pointing the same way beat one precise measurement.
If you want to know whether your fat tissue is getting in your metabolic way, blood is the more logical place to look than the scan. How much muscle sits under that fat is covered in skeletal muscle mass.
Every blood test result includes a professional assessment from a BIG-registered doctor. For treatment decisions, discuss your results with your GP.
References
- Gallagher D, Heymsfield SB, Heo M, Jebb SA, Murgatroyd PR, Sakamoto Y. Healthy percentage body fat ranges: an approach for developing guidelines based on body mass index. The American Journal of Clinical Nutrition, 2000;72(3):694-701. PMID 10966886.
- Romero-Corral A, Somers VK, Sierra-Johnson J, et al. Normal weight obesity: a risk factor for cardiometabolic dysregulation and cardiovascular mortality. European Heart Journal, 2010;31(6):737-46. PMID 19933515.
- Ackland TR, Lohman TG, Sundgot-Borgen J, et al. Current status of body composition assessment in sport: review and position statement on behalf of the ad hoc research working group on body composition health and performance, under the auspices of the I.O.C. Medical Commission. Sports Medicine, 2012;42(3):227-49. PMID 22303996.
- Esco MR, Snarr RL, Leatherwood MD, et al. Comparison of total and segmental body composition using DXA and multifrequency bioimpedance in collegiate female athletes. Journal of Strength and Conditioning Research, 2015;29(4):918-25. PMID 25353076.
- Zemski AJ, Keating SE, Broad EM, Slater GJ. Same-day vs consecutive-day precision error of dual-energy X-ray absorptiometry for interpreting body composition change in resistance-trained athletes. Journal of Clinical Densitometry, 2019;22(1):104-114. PMID 30454952.
- Jackson AS, Pollock ML. Generalized equations for predicting body density of men. British Journal of Nutrition, 1978;40(3):497-504. PMID 718832.
- Mountjoy M, Ackerman KE, Bailey DM, et al. 2023 International Olympic Committee's (IOC) consensus statement on Relative Energy Deficiency in Sport (REDs). British Journal of Sports Medicine, 2023;57(17):1073-1097. PMID 37752011.
- RIVM. Leefstijlmonitor, figures on overweight in adults.
- Voedingscentrum. Waist circumference and healthy weight.
- Gezondheidsraad. Physical activity guidelines.
Autor
Enhanced Health
Powiązane badania
Powiązane artykuły
Skeletal muscle mass: what is normal and how much can you add?
InBody measurement: what the numbers mean and where they miss