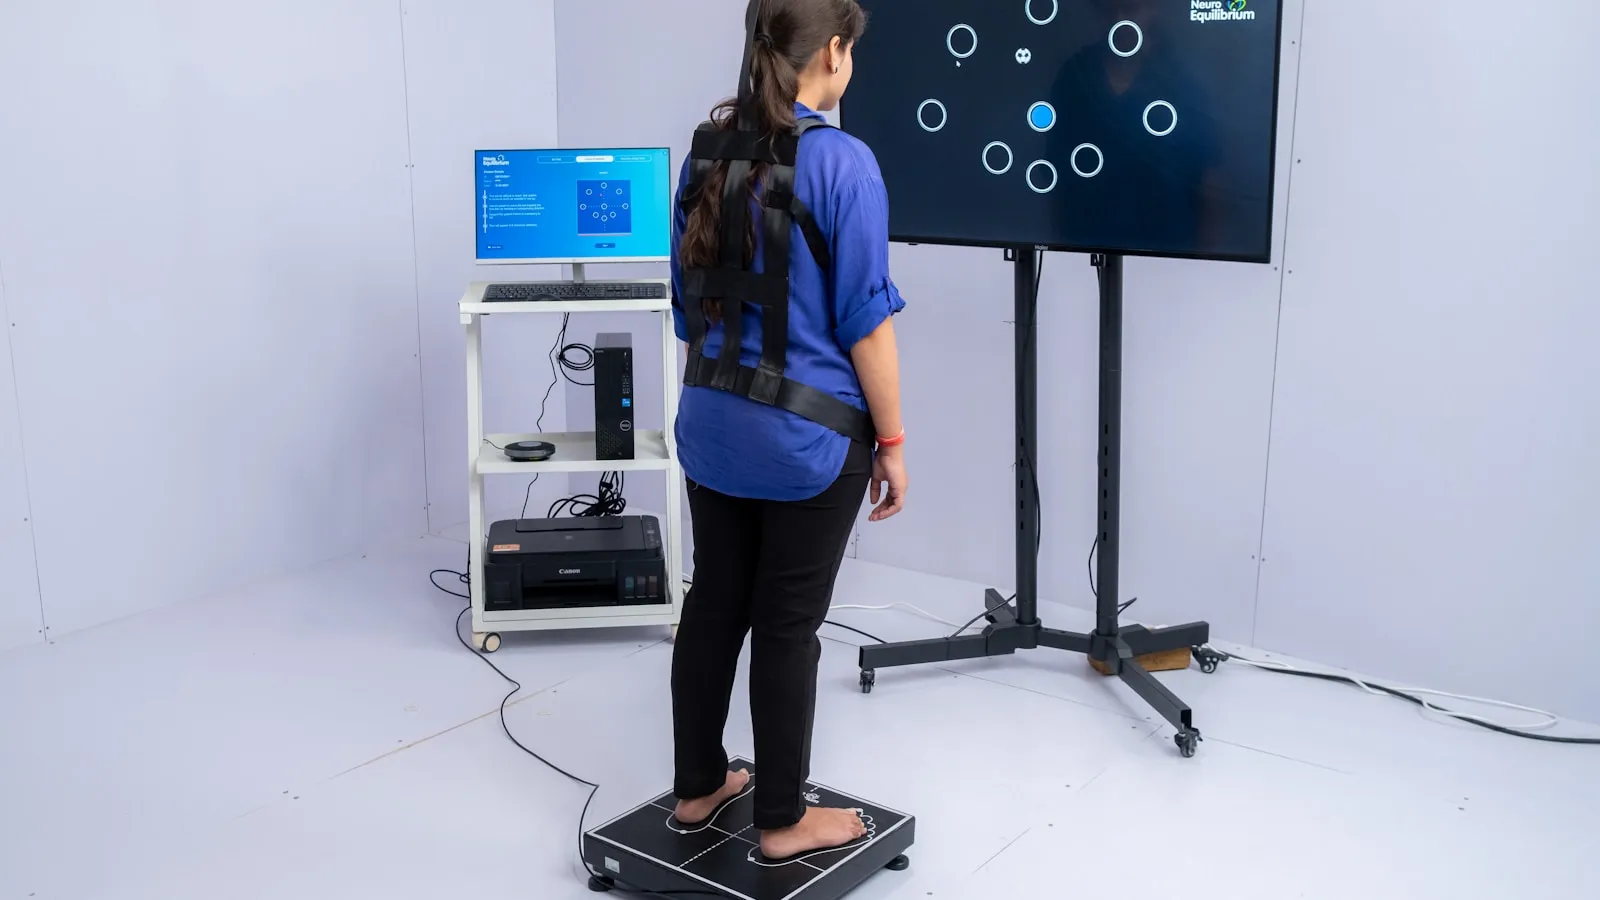
An InBody measurement is a professional bioimpedance test: you stand on electrodes and hold handgrips, so current runs through your arms, trunk and legs. It produces a sheet with ten to twenty numbers. Useful for trends, and not every number on that sheet deserves equal trust.
The chart most gyms point at first is precisely the weakest part.
Which is a shame, because the measurement itself is one of the better ones in its price class.
What is on an InBody result sheet?
Roughly three blocks. At the top, composition in kilos: total weight, skeletal muscle mass and fat mass. Below that the derived figures: body fat percentage, BMI and a score. At the bottom the segmental analysis per arm, leg and trunk, plus a visceral fat rating and an estimate of your resting metabolism.
| Line on the sheet | What it is | How much trust |
|---|---|---|
| Weight | simply weighed | high, the only directly measured figure |
| Skeletal muscle mass | estimated from resistance | reasonable as a trend, not absolute |
| Body fat percentage (PBF) | derived from the rest | moderate, it stacks the errors |
| Segmental analysis per limb | resistance per segment | low in trained people |
| Visceral fat rating | estimate on its own scale | low, not comparable to DEXA grams |
| Resting metabolism | formula on your fat-free mass | low, it is arithmetic |
| ECW/TBW ratio | fluid distribution | useful, mainly when it changes |
Only the top line is genuinely measured. The rest is derived.
That does not make the sheet worthless. It does mean the uncertainty grows as you read down it.
How accurate is an InBody measurement?
Better than a home scale, and not as good as the brochure implies. For total body fat percentage, multifrequency BIA came out 3.3 percent lower than a DEXA scan on average in comparative research, with limits of agreement reaching about 5.6 percent either way (PMID 25353076).
That study used an InBody 720 in college athletes, in a lab.
The segmental numbers fare worse. Brewer and colleagues compared multifrequency BIA against DEXA in Division I athletes and found fat-free mass in the arms and legs was consistently underestimated (PMID 31469766). Their conclusion was that the device was not valid for those measures in a lean, athletic population.
Exactly the group that steps onto it in a gym.
The pattern makes sense. Bioimpedance infers muscle from water, and trained muscle binds more water than the reference group the equation was calibrated on. The IOC working group around Ackland warned about this back in 2012: every field method inherits the assumptions of its reference method (PMID 22303996).
Which numbers on the sheet are usable?
The top three lines, as a trend. Your weight is measured. Your skeletal muscle mass and fat mass in kilos are estimates, but they move consistently in the right direction when you do. The relationship between those two across three months is the most useful thing an InBody gives you.
Look at kilos, not percentages.
That sounds backwards, but a percentage also changes when the denominator changes. Say you weigh 85 kilos with 34 kilos of muscle, so 40 percent, and you lose two kilos of fat: your muscle percentage climbs to 41 without a gram of new muscle.
In kilos you see straight away what actually happened. That 34 was there before and after.
The ECW/TBW ratio is the second figure worth attention. It says something about how your fluid is distributed, and a sudden shift often coincides with a heavy training week or a bad night. Handy context for a reading that looks odd.
What you can ignore: the resting metabolism and the InBody score. Both are arithmetic on the earlier estimates and add no measurement.
How do you make two InBody measurements comparable?
By holding everything except your body constant. Measure fasted, in the morning, after the toilet, before training and before drinking. Same machine, same clothing, bare feet, dry hands. Fluid differences are the main reason two readings in one week diverge.
Never measure right after cardio. You are warm, flushed and mildly dehydrated.
One more practical point: the handgrips must be clean and dry. Sweat or body lotion lowers contact resistance and shifts your reading without you noticing.
Everything else that tugs at your bioimpedance is listed in the body composition scale.
InBody or something else?
It depends what you will do with it. For a monthly check at your own gym an InBody measurement is a sound choice: consistent machine, fast test, reasonable trend. For an absolute figure to base a months-long cut on, the error margin is too wide.
That is where a DEXA scan becomes the logical step, with a skinfold measurement as a cheap alternative that ignores your fluid balance. The full comparison is in body fat percentage: what is healthy and how to measure it.
What an InBody does not measure at all is how your metabolism handles that fat. The Voedingscentrum uses 94 centimetres of waist circumference for men and 80 for women as a first signal boundary, and according to figures RIVM tracks through the Leefstijlmonitor about half of Dutch adults carry excess weight.
Inside that group the metabolic picture varies widely. You read that difference from values such as HbA1c and your fasting insulin, not from a percentage on a printout.
My advice: keep the printouts and compare only the top three lines across three months. The rest of the sheet you can throw away.
Every blood test result includes a professional assessment from a BIG-registered doctor. For treatment decisions, discuss your results with your GP.
References
- Esco MR, Snarr RL, Leatherwood MD, et al. Comparison of total and segmental body composition using DXA and multifrequency bioimpedance in collegiate female athletes. Journal of Strength and Conditioning Research, 2015;29(4):918-25. PMID 25353076.
- Brewer GJ, Blue MNM, Hirsch KR, Peterjohn AM, Smith-Ryan AE. Appendicular body composition analysis: validity of bioelectrical impedance analysis compared with dual-energy X-ray absorptiometry in Division I college athletes. Journal of Strength and Conditioning Research, 2019;33(11):2920-2925. PMID 31469766.
- Ackland TR, Lohman TG, Sundgot-Borgen J, et al. Current status of body composition assessment in sport. Sports Medicine, 2012;42(3):227-49. PMID 22303996.
- RIVM. Leefstijlmonitor, figures on overweight in adults.
- Voedingscentrum. Waist circumference and healthy weight.
Autor
Enhanced Health
Dr. Naimi, lekarz wpisany do holenderskiego rejestru BIG, nadzoruje standardy medyczne naszych treści i ocen. Przeczytaj naszą politykę medyczną
Powiązane badania
Powiązane artykuły
Cardio before or after strength training? What decides the order

Overtraining symptoms: 8 signs and what else could be behind them