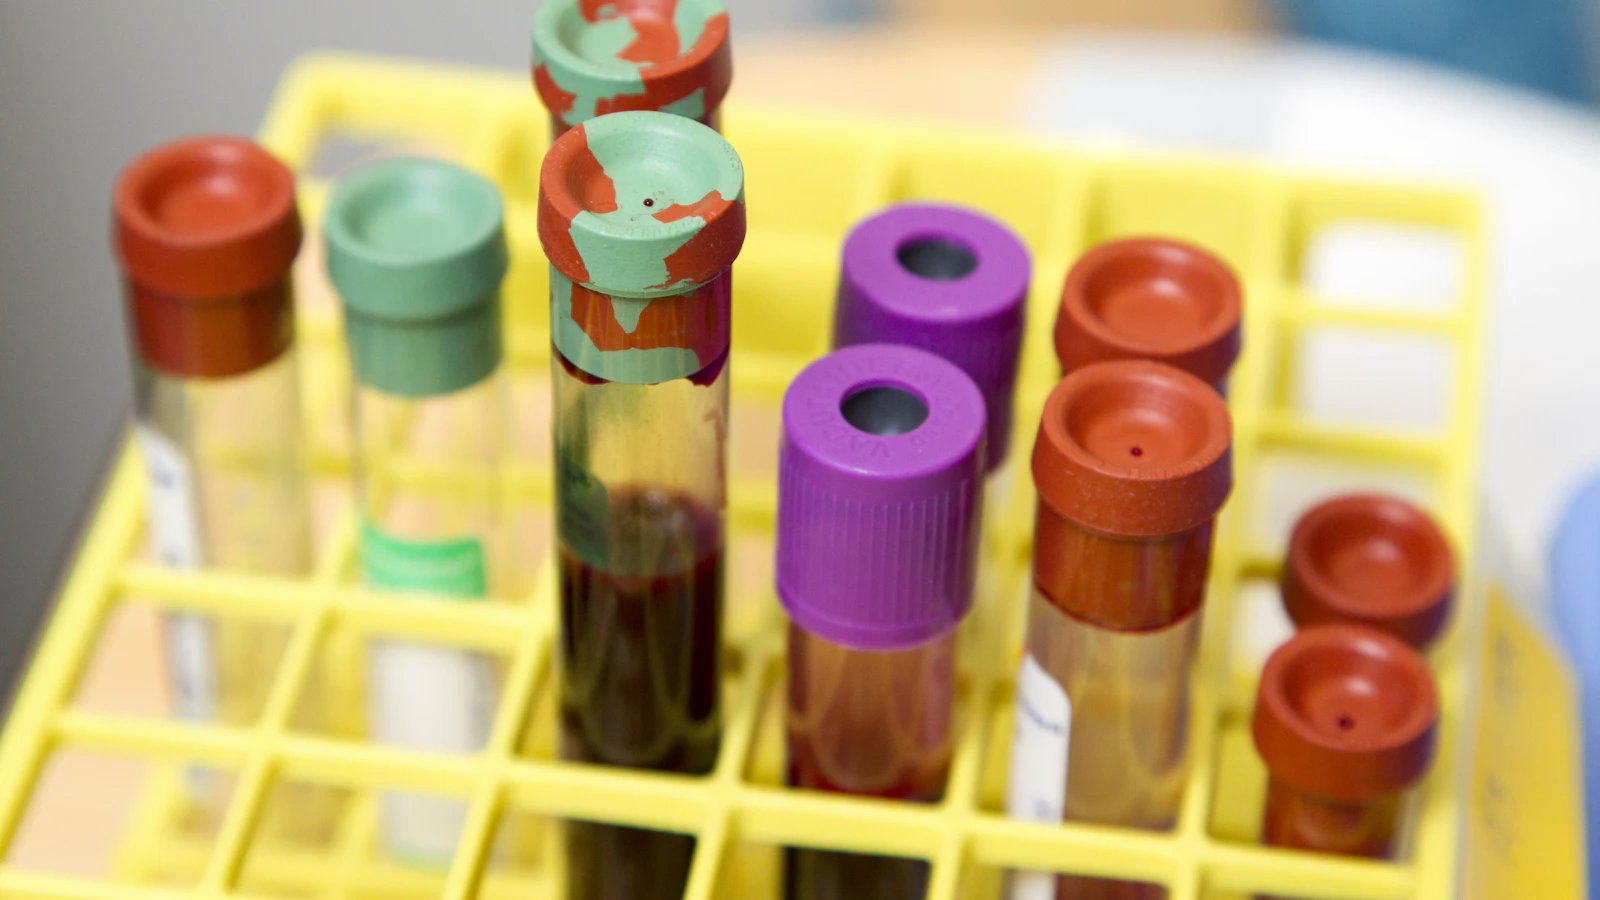
Your cholesterol blood values measure how many fat particles move through your blood and how they are distributed. A lipid panel shows your total cholesterol, LDL, HDL and triglycerides, in mmol/l. The ratio and the number of LDL particles (ApoB) often say more about your heart than a single number.
Honestly? One value out of context means little. Your whole profile tells the story.
In this guide I walk you through your lipid profile value by value: what each number means, which reference ranges are common, and where you can actually make a difference. No scare story, just learning to read your data.
What are normal cholesterol blood values?
As a guideline, many people aim for a total cholesterol below 5.0 mmol/l, an LDL below 3.0 mmol/l, an HDL above 1.0 (men) or 1.3 (women) and triglycerides below 1.7 mmol/l. These are general reference values. Your personal target depends on your overall risk profile.

Important: these numbers are not a report card. Someone with many risk factors may aim for a lower LDL than someone without. The table below is a reading aid, not a diagnosis.
Below you will find the cluster reading guide with the common thresholds. Click a marker to dive deeper into that single value. Think of it as an index: this pillar article gives the overview, the linked pages go into depth.
| Blood value | Common reference (mmol/l) | What it broadly indicates |
|---|---|---|
| Total cholesterol | < 5.0 | The sum of all cholesterol fractions in your blood. |
| LDL cholesterol | < 3.0 | The particle that can build up in your artery wall. |
| HDL cholesterol | > 1.0 (men) / > 1.3 (women) | Transports cholesterol back to your liver. |
| Triglycerides | < 1.7 | Fats linked to diet and insulin. |
| Cholesterol ratio (total/HDL) | < 4.5 as a rough guide | The ratio says more than one single number. |
| ApoB (optional) | < 0.9 g/l as a rough guide | Counts the actual number of harmful particles. |
| Lp(a) (optional) | < 75 nmol/l as a rough guide | Inherited, measuring once can be enough. |
These values recur throughout the cluster. If you want the complete set in one go, take a look at the lipid panel.
LDL, HDL and triglycerides: what each number means
LDL carries cholesterol to your tissues and can build up in the artery wall. HDL does the opposite and transports it back to your liver. Triglycerides are fats from food and your own production. Together they sketch how your fat metabolism runs, not whether you are ill.
LDL rightly gets the most attention. The more LDL particles circulating, the bigger the chance one lodges in your artery wall. The Hartstichting explains this mechanism clearly: cholesterol can settle in the wall and slowly form a plaque there.
Want to know which value is healthy and how to adjust your level? Read lowering LDL cholesterol: what is a healthy value.
HDL works like your internal cleanup crew. A higher HDL is linked to a more favourable profile, although more is not always automatically better. In HDL cholesterol: the good cholesterol and how to raise it I unpack what you can do yourself.
Triglycerides respond strongly to sugar, alcohol and your last meal. A high value can point to insulin resistance. How to read and lower them is covered in triglycerides in your blood: what they mean and how to lower them.
A common misconception is that cholesterol is bad in itself. That is not true. Your body needs cholesterol for your cell walls, your hormones and your vitamin D. It is about the distribution and the transport, not the substance itself.
What I like about these three values: each responds to different dials. LDL mainly follows your saturated fat and your genes, HDL moves with exercise and body weight, and triglycerides often drop fastest when you cut sugar and alcohol. That way your lifestyle becomes visible in your blood.
That makes these three together a handy baseline gauge. If your profile changes after a few months of targeted training or nutrition, you see fairly quickly where the effect sits.
Cholesterol ratio: why the proportion says more than one number
The cholesterol ratio divides your total cholesterol by your HDL. That proportion captures the balance between harmful and protective particles in a single figure. A ratio below roughly 4.5 serves as a rough guide. Two people with the same total cholesterol can have a very different story.
Picture this: you and your training partner both have a total cholesterol of 5.2 mmol/l. You have an HDL of 1.8 and he has 0.9. Your ratio is 2.9, his is 5.8. The same headline number, a completely different signal.
This is exactly why a quick glance at total cholesterol alone can mislead you. A high total driven by lots of HDL looks very different from a high total driven by lots of LDL. The ratio brings that difference into view straight away.
That is why I prefer to look at the proportion rather than the loose total. Non-HDL cholesterol (total minus HDL) does something similar: it bundles all harmful fractions into one value.
A favourable ratio is no free pass. It tells you something about the balance, not the absolute number of particles. For that you look at ApoB.
The ratio is also handy because it is robust. Eat less healthily for a day and your loose LDL fluctuates sooner than the proportion between your values. For tracking a trend across several measurements, that is convenient.
Still, it remains a helper number. A fine ratio with a high LDL is a different story than a fine ratio with a low LDL. So always read your values in context, not as loose figures in a row.
Beyond the standard panel: ApoB and Lp(a)
The standard panel measures how much cholesterol your particles carry, not how many particles there are. ApoB counts the actual number of harmful particles and often aligns more closely with your risk. Lp(a) is a largely inherited variant your standard panel misses. Measuring once can be enough.
ApoB is interesting because each harmful particle carries exactly one ApoB protein. Genetic research convincingly links long-term exposure to LDL particles with arterial hardening (Ference et al., 2017). More on this marker is in ApoB: the heart risk marker your GP usually does not measure.
Lp(a) is largely set in your genes and barely changes with lifestyle. An elevated Lp(a) can be an independent risk factor (Nordestgaard et al., 2010). Because it is stable, some people choose to have it determined once. Read Lp(a): the inherited heart risk marker your doctor rarely measures and see the marker page Lp(a).
Why can this be useful? Sometimes someone has a tidy LDL, yet many small, dense particles. The cholesterol content then looks low, while the particle count is high. ApoB exposes that difference, because it counts the particles instead of the cargo inside them.
The Hartstichting describes how arterial hardening is a creeping process that builds over years. That is precisely why some people who want a clear picture of their risk look beyond LDL alone. It is about long-term exposure, not a single snapshot.
A third piece of the puzzle, separate from cholesterol, is your omega-3 index. How it affects your recovery is covered in omega-3 index: the missing blood value for heart and recovery.
Not everyone needs these extra values. But if you have a family history of early heart problems, or your standard panel gives a mixed picture, ApoB or Lp(a) can be just the missing piece.
Fasting or not: how to prepare for your blood test
For total cholesterol, LDL and HDL you usually do not need to fast, because these values fluctuate little. Triglycerides do respond strongly to your last meal. For the cleanest picture of your triglycerides, some people prefer to test after eight to twelve hours of fasting.
The difference lies mainly in those triglycerides. A fatty meal can lift them substantially for a while. For a fair comparison between measurements, it helps to always test under the same conditions.
My practical advice: measure around the same time, skip heavy alcohol the evening before and stay consistent. That way you compare apples with apples.
A single measurement is a snapshot. A trend over time says far more than today's one number.
Also factor in the timing around your training. A hard endurance effort the day before can temporarily lower your triglycerides, while a party does the opposite. If you want your true baseline, pick a quiet day without extremes.
Illness and inflammation can temporarily distort your values too. If you have just had an infection, you are better off waiting a few weeks before drawing conclusions from a new measurement.
What your values can mean for your training and recovery
For active people, cholesterol blood values are mainly an early dashboard. Intense exercise can raise your HDL and lower your triglycerides, while a high training load sometimes strains your recovery. Your lipid profile shows how your fat metabolism moves with your lifestyle.
Many athletes assume that performing means their blood must be fine. Sometimes that holds, but body composition, sleep and nutrition often weigh more than the kilometres alone.
I regularly see motivated athletes with great fitness and yet a less favourable profile. Often it sits in the details: too many fast carbohydrates around workouts, little sleep in a busy stretch, or an inherited component unrelated to lifestyle. Your values help make that blind spot visible.
Testosterone and your blood lipids are also connected, especially if you use TRT. What that does to your profile is covered in cholesterol and testosterone: what TRT does to your blood lipids.
My advice: treat your values like a training metric. Not to worry yourself, but to turn the right dials with purpose.
Concretely, there are three dials that pay off most for the majority of active people. Nutrition mainly steers your LDL and triglycerides, with less saturated fat and sugar as the base. Exercise and body composition lift your HDL and help bring your triglycerides down.
The third dial is the most underrated: sleep and stress. A chronic lack of recovery can subtly throw your fat metabolism off balance, even if you do everything else right. Your blood values sometimes catch that undercurrent before your feeling does.
What I tell people: do not expect a miracle after one week. Your lipid profile moves over weeks to months. So give an adjustment time before you write it off or fine-tune it.
What now? Your concrete next step
If you have spotted an abnormal value, discuss it with your GP before you overhaul your lifestyle. One number decides nothing, your whole profile counts. If you want to view your lipids in context, you can take the lipid panel as a starting point and follow your values at your own pace.
Bronnen
- Hartstichting. Cholesterol en hart- en vaatziekten. Geraadpleegd 2026.
- Ference BA, Ginsberg HN, Graham I, et al. Low-density lipoproteins cause atherosclerotic cardiovascular disease. 1. Evidence from genetic, epidemiologic, and clinical studies. A consensus statement from the European Atherosclerosis Society Consensus Panel. Eur Heart J. 2017;38(32):2459-2472. PMID: 28444290.
- Nordestgaard BG, Chapman MJ, Ray K, et al. Lipoprotein(a) as a cardiovascular risk factor: current status. Eur Heart J. 2010;31(23):2844-2853. PMID: 20965889.
Disclaimer
Every blood test result includes a professional assessment from a BIG-registered doctor. This article is general information and is not a substitute for medical advice. A blood test is a tool to help you have a better-informed conversation with your GP, not a diagnosis in itself. For treatment decisions, discuss your results with your GP.
With your total cholesterol and HDL on paper, the cholesterol ratio calculator works out the ratio doctors use.
Author
Enhanced Health
Dr. Naimi, BIG-registered physician, oversees the medical standards behind our content and assessments. Read our medical policy
Related Tests
Related Posts

Cholesterol and testosterone: what TRT does to your blood lipids

Lp(a): the hereditary heart-risk marker your doctor rarely measures