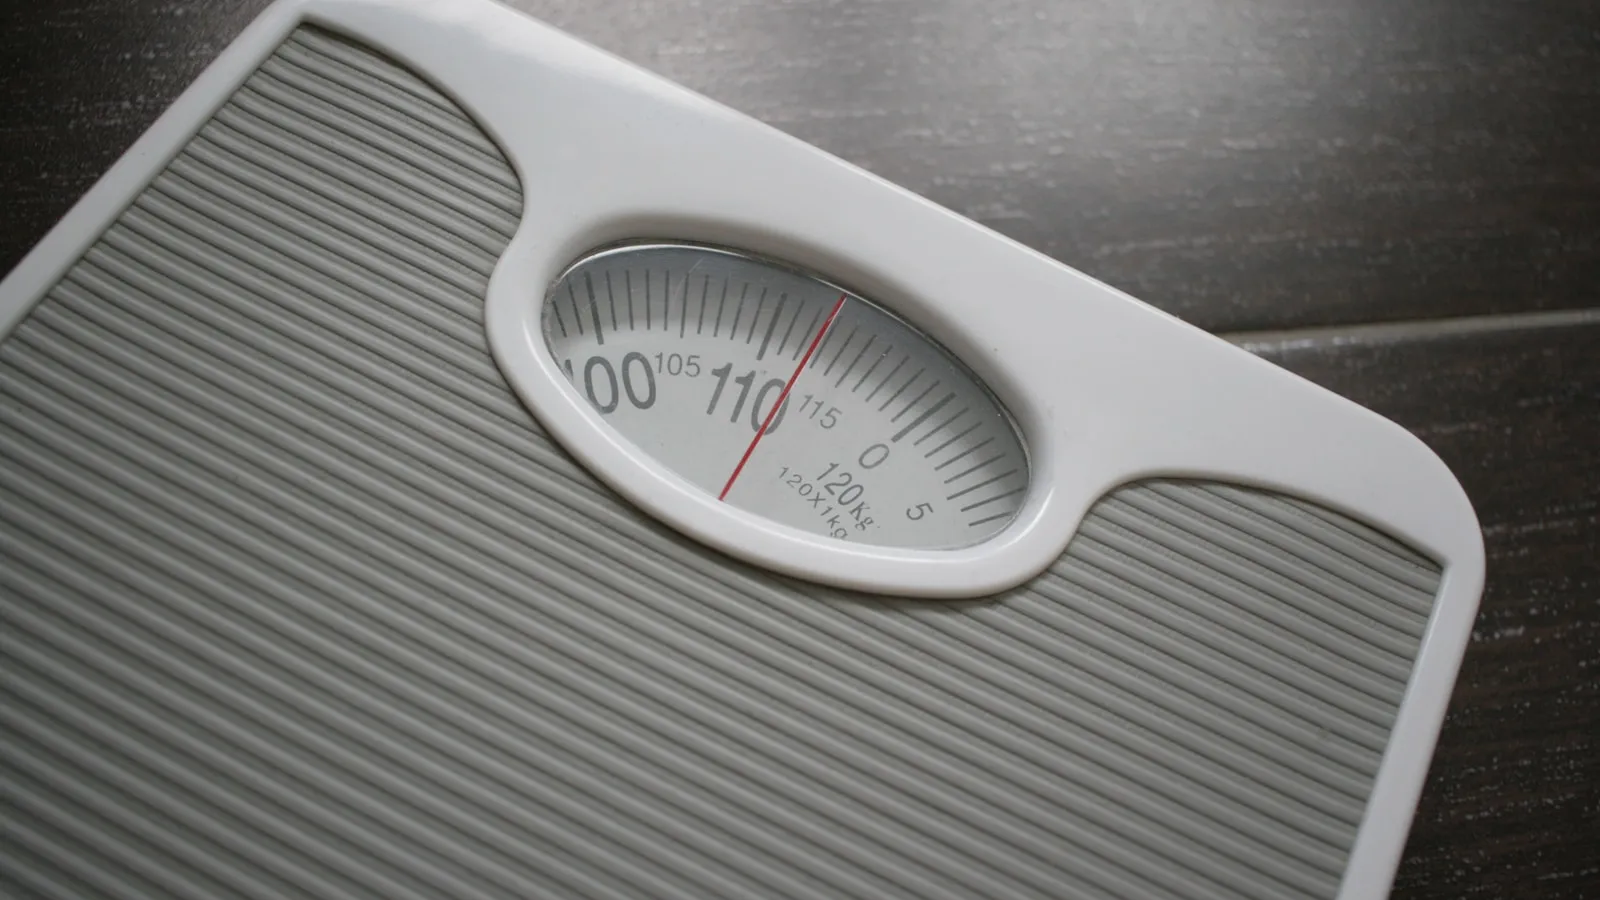
A body composition scale is useful for the direction of your body fat percentage, not for the number itself. Expect a four to eight percent gap against a DEXA scan. In trained people that gap widens, and usually the wrong way.
That is because the scale does not measure fat. It measures resistance.
I used one for years and read far too much into it. Useful device, wrong interpretation.
How does a body composition scale work?
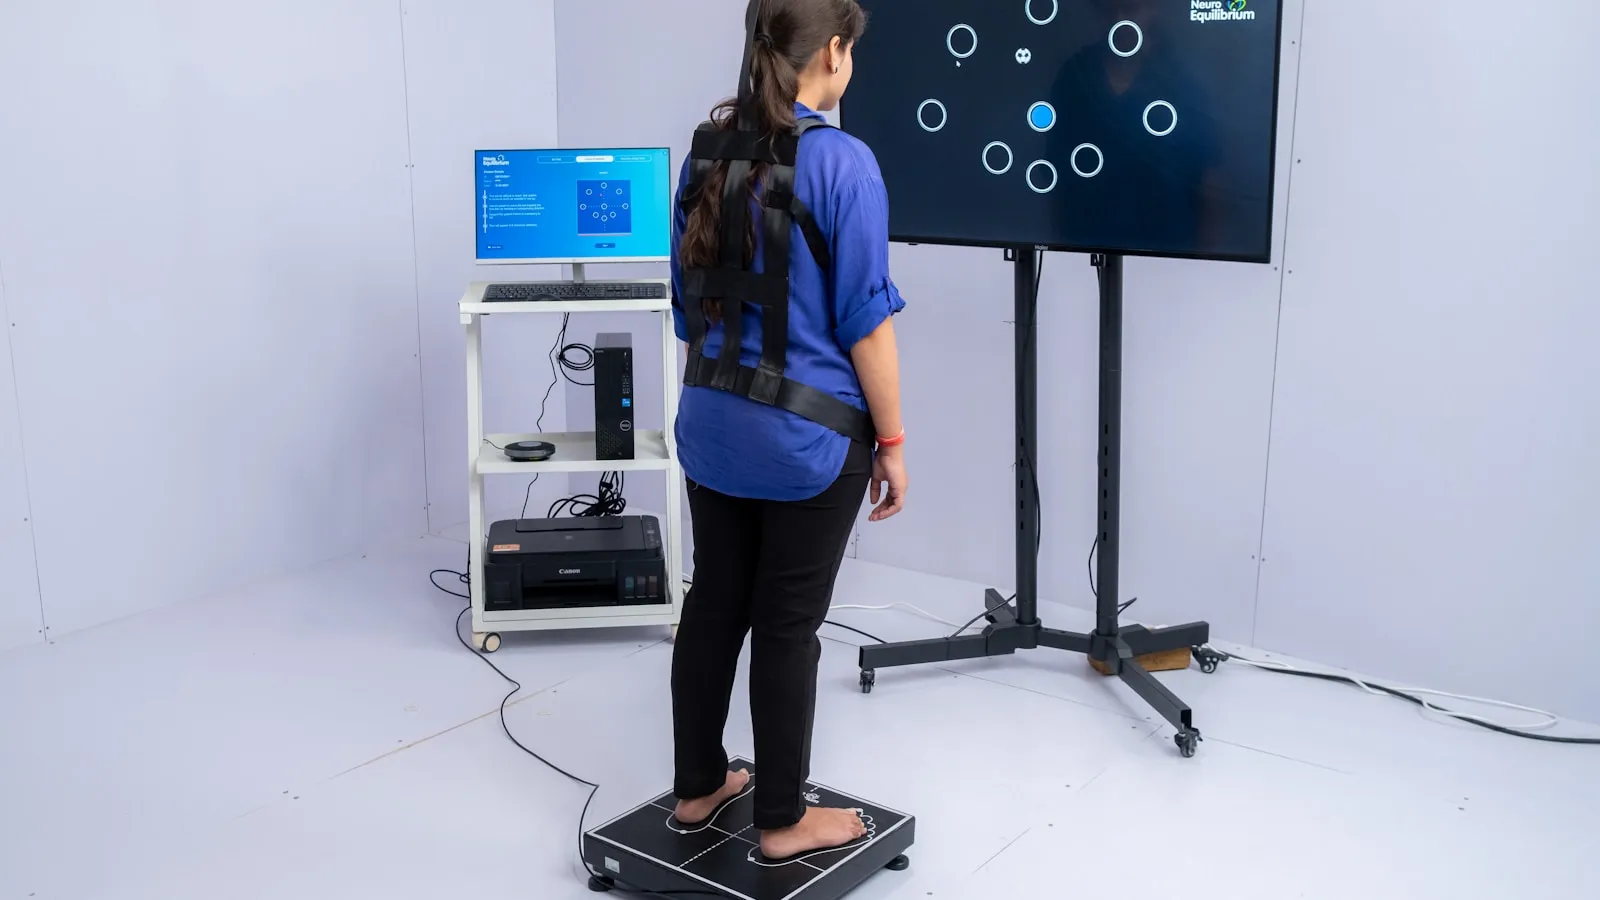
Through bioimpedance. The scale sends a weak alternating current through your body and measures the resistance it meets. Muscle holds a lot of water and conducts well; fat holds little and conducts poorly. From that resistance, plus your weight, height, age and sex, an estimate follows.
Note that last list. Your age and sex are in the equation.
So part of your reading does not come from your body at all. It comes from an assumption about how an average person of your age and sex is built. Deviate from that average, for instance because you train hard, and your reading deviates too.
A home scale has a further limit: it only measures through your feet. The current runs up your legs and back down, while your torso and arms are estimated. Precisely where most people carry their fat.
How far off is a body composition scale?
Further than the box suggests. Professional multifrequency units already sit at three to five percent. A home scale, measuring only through the legs, sits below that. Too coarse for an absolute figure; usable for a trend across months.
The best comparison comes from sports science. Esco and colleagues put an InBody 720, a professional unit costing several thousand euros, next to a DEXA scan in college athletes. The BIA read 3.3 percent lower on average, with limits of agreement running to about 5.6 percent either way (PMID 25353076).
That was the expensive machine, in a lab, under a standardised protocol.
Brewer and colleagues then looked at segmental readings in Division I athletes and found multifrequency BIA consistently underestimated fat-free mass in the arms and legs (PMID 31469766). In lean, trained people the device misses hardest.
Why does your reading jump day to day?
Because water drives the measurement. Anything that changes your fluid balance or glycogen stores changes your resistance, and so your reading. A salty meal, a hard leg session, a glass of water or a bad night can shift your body fat percentage one to three points without adding a gram of fat.
| What you do | Effect on the reading | Roughly |
|---|---|---|
| Drink half a litre of water | more conduction, reads leaner | 0.5 to 1 percent lower |
| Eat salty food the night before | fluid retention, reads leaner | 0.5 to 1 percent lower |
| Eat low carb, glycogen depleted | less bound water, reads fatter | 1 to 3 percent higher |
| Measure after training, sweaty | dehydration plus warm skin | unpredictable, up to 3 percent |
| Measure in the evening instead of morning | fluid shifts toward the legs | 1 to 2 percent lower |
The fourth row is the trap for athletes. Train down toward a competition or the end of a cut and you bind less water in your muscles, so the device reads you fatter. At the exact moment you are leanest.
Say you measure 18 percent on Monday and 20 percent on Friday, having changed nothing.
That is not two percent of new fat. Across four days you can add a few hundred grams at most, which is under a tenth of a percent. The rest is fluid, glycogen and measurement noise.
I have watched people rebuild an entire plan around that. A waste.
So how do you measure usefully?
By holding everything except your body constant. Measure fasted, straight after waking, after the toilet and before you drink or train. Same scale, same spot on a hard floor, bare feet every time. Write it down and only read the line after six weeks.
A carpet under the scale already spoils the reading.
One more thing helps: average three mornings in the same week instead of taking a single measurement. Much of the daily noise drops out of your figure that way. Whatever still moves is probably real.
And never compare two different devices. Two scales that are each four percent off rarely miss in the same direction.
When do you move to something more accurate?
As soon as the decision costs more than the measurement. Heading into a four-month cut, or wanting to know whether a bulk is adding mostly muscle or mostly fat, a five percent error is too wide. That is the point where a DEXA scan or a good skinfold measurement earns its place.
How those two compare sits in the DEXA scan and the skinfold measurement. The full comparison of all five methods, with the error margins side by side, is in body fat percentage: what is healthy and how to measure it.
There is another reason not to stare at one number. Your body fat percentage says nothing about how your metabolism handles that fat. People with a normal BMI but a high body fat percentage more often showed metabolic abnormalities (PMID 19933515), and that is an association in a large group, not a prediction for you.
According to figures RIVM tracks through the Leefstijlmonitor, about half of Dutch adults carry excess weight. Where you sit in that distribution matters less than what your blood says about it.
My advice: use the scale for direction, and let fasting glucose and insulin answer whether it is getting in your metabolic way. Every blood test result includes a professional assessment from a BIG-registered doctor. For treatment decisions, discuss your results with your GP.
References
- Esco MR, Snarr RL, Leatherwood MD, et al. Comparison of total and segmental body composition using DXA and multifrequency bioimpedance in collegiate female athletes. Journal of Strength and Conditioning Research, 2015;29(4):918-25. PMID 25353076.
- Brewer GJ, Blue MNM, Hirsch KR, Peterjohn AM, Smith-Ryan AE. Appendicular body composition analysis: validity of bioelectrical impedance analysis compared with dual-energy X-ray absorptiometry in Division I college athletes. Journal of Strength and Conditioning Research, 2019;33(11):2920-2925. PMID 31469766.
- Ackland TR, Lohman TG, Sundgot-Borgen J, et al. Current status of body composition assessment in sport. Sports Medicine, 2012;42(3):227-49. PMID 22303996.
- Romero-Corral A, Somers VK, Sierra-Johnson J, et al. Normal weight obesity: a risk factor for cardiometabolic dysregulation and cardiovascular mortality. European Heart Journal, 2010;31(6):737-46. PMID 19933515.
- RIVM. Leefstijlmonitor, figures on overweight in adults.
الكاتب